Resources
Fresh perspectives on reducing work friction and improving employee experiences. Research, case studies, and insights on how FOUNT helps transform workflows.
.webp)
WHITEPAPER: Work Friction
Every organization struggles with work friction. It is both ubiquitous and perceived as insurmountable. For large companies with many thousands of employees, the challenge grows exponentially.
Work friction is tied not just to productivity and profit, but to many of their drivers, like employee satisfaction, engagement, well-being, burnout, retention, attraction, likelihood to recommend, and a host of other individual and business outcomes. This white paper offers a clear and comprehensive definition of work friction, broken down into its individual components.
You will learn:
- What work friction is and why it matters
- The difference and relationship between work and organizational friction
- The Top 5 questions people ask about work friction
Are you ready to reduce friction and get work flowing at your organization? Contact us to learn more or book a demo.
Please fill out the form below to download the whitepaper.
"FOUNT’s SaaS Platform Fights Workplace Friction"
The Futurum Group is a global technology research and advisory firm for high-tech. Senior analyst, Sherril Hanson, recently sat down with FOUNT’s cofounders to learn more about work friction, our latest research, and results from one of our customers. Volker Jacobs, FOUNT cofounder.
Analyst Take: Friction is a favorite term among experience focused practitioners and researchers, and for good reason. It is often these everyday points of irritation and inefficiency that add up to lower employee engagement scores and potential employee attrition. However, often these work friction points remain undiscovered, even with employee feedback or voice of the employee programs in place.
FOUNT was founded in 2022 as a spinout of the employee experience consultancy TI People. The company has headquarters in Washington, DC, and offices in London and Hamburg. The company is backed by Lavrock Ventures, Osage Venture Partners, and Grotech Ventures and has a host of customers such as Adidas, Pfizer, Pepsi, and UnitedHealth Group.
Both cofounders have personal background in human resources (HR) transformation, and the genesis of FOUNT came from the goal of wanting to provide more value and measurability to employee experience (EX) and bring visibility to HR leaders into what was going well and what was not.
I was recently able to chat with FOUNT Cofounder and CEO Christophe Martel and Cofounder Volker Jacobs and to learn more about the FOUNT platform and the push/pull between employees who want a great work experience and companies who want productivity and growth.
“Work friction, especially in large organization is everywhere. We view friction as something that is in between two worlds that are sometimes disconnected. So, in the world of employees, people want to have a great experience at work. They may want a larger voice in issues such as how they work and from where. For companies, they are constantly on the search for new productivity gains and they often don’t have a great view into the way employees perceive their experience, across their work moments. Perhaps they can pick up on an issue, but they can’t really get to the root cause. That’s the areas we are focusing in on, really giving visibility into where friction sits, how big of a problem is it and how can it be influenced and impacted.”

How Employees Impact Business Performance
Commitment to employee experience is growing. With commitment comes expectation, and EX Leaders find themselves in a crucial performance window.
Commitment to employee experience is growing. In our recent Human Experience of Work study, 90% of employee experience Leaders indicate increased organizational intent around understanding and improving people’s experiences of work. CEO and board attention; defined employee experience roles and responsibilities; and budget allocation have been on the rise.
With commitment comes expectation, and employee experience Leaders find themselves in a crucial performance window. Employees expect consistent activity that delivers improved experience quality.
Executive stakeholders need to see quantified impact against their specific business or functional objectives. CEOs and Boards want evidence of progress quickly as proof that investments are yielding. Moreover, the world of work continues to shift and experience leaders must keep pace.
Working with the business
One critical element to maintaining momentum in EX is to what extent EX Leaders can fully engage and work with the business. Leaders with EX responsibility will more convincingly engage business stakeholders in EX when they can point to precise improvement opportunities – with evidence. Also, talk about ROI cannot be a generic conversation. It needs to be aligned to business leaders’ specific objectives and value conveyed through their business KPIs.
Yet only 24% of organizations surveyed report having the requisite qualitative and quantitative experience data in place to inform experience decision-making with business partners. Many studies, for example, have explored the ROI of internal customer experience and its link to external customer experience and resulting revenue growth, but the ROI exploration often stops there. 90% of organizations believe calculating the ROI of internal customer experience and its linkage to outcomes for their organization is essential, but they have not yet reached this stage.
Meeting executives where they are
Purposeful dialogue starts with meeting executives “where they are” by showing EX’s relevance to their business objectives. It should be defined by value delivered to people and business in the form of observable, measurable outcomes. The ‘Business Value tree’ pictured, for example, shows how one customer facing organization visualized how experience drives business results. They used this approach to support more effective conversations specifically with senior customer facing leaders.

Essential inputs
It is important to note that one ‘business value story’ does not fit the needs of all leaders, nor fully conveys the potential scope of impact. As with employees, appropriate context is essential to understand needs. For example, a functional executive serving internal customers such as a CIO will work with a partially different set of KPIs from a customer-facing leader referenced above, such as UX, internal customer satisfaction, or cost.
In addition, without access to the right (first-hand, interaction level) data, people’s experience expectations of the business will not be fully understood at scale. EX teams need new, experience-centric data inputs to pinpoint opportunities for meaningful experience improvement that are truly relevant to people and business outcomes.
Through our Experience Intelligence solutions, we continue to support EX Leaders and their teams on the activities and capabilities required to drive EX impact — and connect it back to business objectives. We invite you to join in our latest research efforts by participating in our short survey.
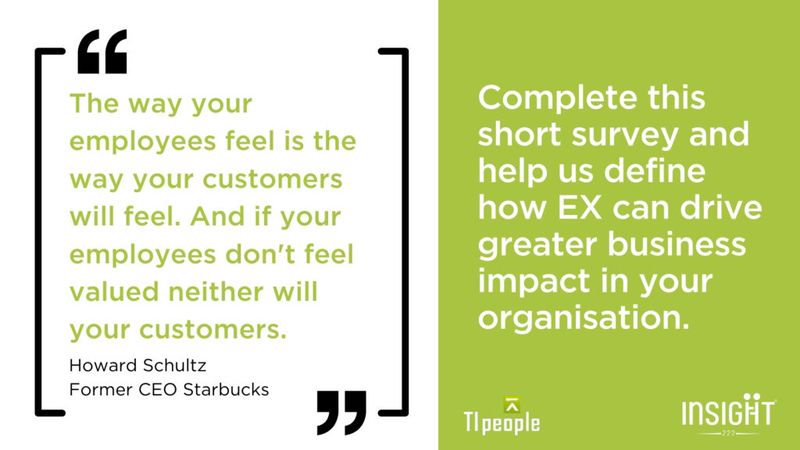
Our latest research aims to identify the activities and capabilities EX teams need to better demonstrate business impact.
This survey will result in a robust understanding of how well EX teams demonstrate business impact today, so that you can compare your team’s approach to leading examples around the world. It will also provide a set of clear recommendations and guidance for demonstrating business impact to business leaders, in order to gain long-term engagement and investment.
Participate in the research and be among the first to view the findings and access detailed recommendations for demonstrating business value to business leaders, in order to gain long-term engagement and investment.
15 Ways to Reward Employees Without Offering Money
If your company’s budget isn’t quite ready for handing out bonuses, there are still plenty of ways you can show your team they’re appreciated. FOUNT’s Chief Experience Officer, Anne Eidelman, contributes to this article featured on the American Express website.
While many employees would opt for compensation if given the choice, there are many ways to recognize and reward individuals for a job well done that don’t cost a thing. In this article, Anne Eidelman shares how FOUNT make kudos part of our natural flow of work. Excerpts from the article showcase how the company gives positive feedback and gift cards.
“It may seem obvious, but many managers underestimate the value of giving positive feedback to their team members. This no-cost approach can be very affirming and motivating for employees at any level,” says Anne Eidelman, Chief Experience Officer at FOUNT Global, Inc, a software-as-a-service (SaaS) company focused on reducing work friction. (FOUNT Global is a subsidiary of TI People.)
Eidelman says that the positive feedback strategy is part of FOUNT Global’s corporate culture. “When we gather for all-hands video calls, we’ve instituted time for informal shout outs where team members can recognize each other and share stories that surprise and delight everyone,” Eidelman says. “Employees have remarked that it’s become the best part of their week and they could really feel the love and energy across time zones.”
Hand out $25 in cash, and employees are may think, “Really? That’s it?” But a $25 gift card to a favorite coffeehouse or retailer can feel generous.
Eidelman says that FOUNT’s managers will some times give employees $25 gift cards for meal or grocery delivery, usually after someone finishes a big project. She says that they’ll generally include a note that reads something like, “Thanks! Please let FOUNT buy you dinner for a job well done.”
“These gestures help employees feel seen and appreciated,” Eidelman says.“And managers have even received pictures of the person’s delicious meal.”
As a remote-first, global company, FOUNT also ticks the box under the suggestion, “Let your employees work from home.” We are proud to have employees working all over the world including Iceland, Houston, Nigeria, Hamburg, Ireland and Long Island, just to name a few!
Raising The Benefits Bar
In today’s competitive landscape, companies are rethinking employee perks and healthcare add-ons to attract and retain talent.
Dale Buss, a long-time contributor of Chief Executive, Corporate Board Member, a leading media for CEOs and senior executives who run large and mid-sized enterprises that aims to grow, build and strengthen their society, writes about the complexities and emerging trends in corporate benefits, advocating for a proactive and innovative approach to bolstering employee well-being and engagement.
In the article, Christophe Martel, CEO of FOUNT Global underscores the critical need for effective communication and accessibility of benefits to enhance employee satisfaction and productivity.
“In many organizations, the corporate center has designed and made available all sorts of benefits, but most employees don’t know these things exist or how to access them easily. Typically, the front line is most unaware. It’s not just about communications but about having tools and processes and an environment where this is easy to do.”
Christophe’s observations highlight a critical aspect of work friction—the disconnect between what companies offer and what employees know or use. This gap can lead to dissatisfaction, underutilization of resources, and a sense of not being valued, all of which contribute to work friction.
Effective communication and making it easier for employees to access and understand their benefits can significantly reduce this friction. The article ends by talking about fostering an environment where benefits are clearly communicated and easily accessible, companies can enhance employee satisfaction, reduce turnover, and create a more engaged and productive workforce.
To read the full article, visit the Corporate Board Member Website.
ABOUT CORPORATE BOARD MEMBER
Corporate Board Member is a publication for the community of directors and executives who wants to enhance their leadership skills and enabling them to make informed decisions to help their organizations thrive and grow.

FOUNT Announces Next-Generation SaaS Platform Tackling the Pervasiveness of Work Friction
The product takes a novel approach to addressing the two sides of poor business and employee performance resulting from wasted work
WASHINGTON D.C.—September 19, 2023—FOUNT Global, Inc. (https://getfount.com) today announced the release of its namesake SaaS platform, the first-ever work friction management solution that identifies solvable points of friction in everyday work moments and helps prioritize the most impactful fixes. FOUNT helps organizations surface and resolve misaligned jobs, policies, technologies, and processes that generate the most resistance for individuals in their day-to-day work.
Employees experience work friction when accomplishing a goal takes more energy than they feel it should. Gartner estimates two-thirds of employees waste up to 2 hours per day working around unnecessary friction. Work friction is a major driver of stalled productivity and a quit rate that has more than doubled in the last decade despite increasing investment in HR and process improvement tools.
“Work dysfunction is a phenomenon that both pre-dates and persists after the pandemic, and it’s getting worse, particularly for large organizations,” said Christophe Martel, Co-founder and CEO of FOUNT Global, Inc. “Two hours of wasted work per employee per day costs the average Fortune 500 business $359 million a year, and also leads to frustration, burnout and eventual attrition, which compounds the negative effect on business performance and customer experience. FOUNT is filling a gap in the broader landscape of work technology by focusing on the root cause of impediments to performance and progress.”
“Unmanaged friction costs €158 million per 10k employees, through attrition, burnout, and wasted productivity,” said FOUNT Co-founder Volker Jacobs. “Work culture, values, policies and legislation vary across Europe which means causes of friction also vary. FOUNT is unique in its ability to help large organizations solve for these differences at all levels.”
Because work friction is typically only visible to those doing the work, FOUNT’s approach is centered on what people do every day and when the work environment supports or hinders them. High-fidelity visualizations and configurable dashboards prioritize where companies can make meaningful and measurable improvements across functional silos in IT, HR and the business.
“Work friction, an ever-present challenge for large organizations, has been overlooked and underrepresented by data until now,” said David Green, Co-Author of Excellence in People Analytics, Managing Partner at Insight222 and host of the Digital HR Leaders podcast. “FOUNT has developed a novel approach and powerful platform that should appeal to a cross-section of leaders focused on making work better for employees and the bottom line.”
Key capabilities and benefits include:
- Moment-centric work friction data: Comprehensive data set of human, physical and digital touchpoints individuals encounter in the context of the specific work activities they perform.
- Benchmarking: Nearly 5 million work friction data points enable companies to measure progress against peers and within their own organizations. This dataset will become a qualitative AI training ground for insights, reporting, and other features to come.
- Prioritization: Friction exists everywhere and resources are limited. FOUNT prioritizes which solutions will have the biggest impact on reducing work friction, enabling companies to address issues with focus and precision which saves time and money.
- Solve for one or all: Start small by focusing on a specific theme of importance to all employees (e.g. career mobility, wellness, etc.) or on the day-to-day work of key talent segments (e.g. frontline workers, call center employees, nurses, etc.).
- Proven workflows and templates: Tested and configurable templates of hundreds of different work moments so companies don’t reinvent the wheel.
- Strong customer support: FOUNT’s staff works closely with companies throughout the process to help them understand and take action on their work friction data.
- Fast implementation: Receive recommendations in as little as 6 weeks.
The company is also announcing a new corporate website and domain. FOUNT will be exhibiting at the HR Technology Conference in Las Vegas from October 10-13 and the HR Data Summit in Munich on November 28th. To schedule a demonstration, visit https://getfount.com
About FOUNT Global, Inc.
FOUNT believes work should be frictionless for employees and employers. The company offers software-as-a-service (SaaS) solutions that identify what’s at the root of productivity and attrition challenges. By helping organizations prioritize and fix causes of friction in employees’ work environment, organizations can measurably improve performance and employee experiences. FOUNT’s customer base represents some of the world’s leading organizations including adidas, Siemens, Baloise, Northwell Health, TÜV SÜD and TEKsystems. Founded in 2022 as a spinout of the employee experience consultancy, TI People, FOUNT is headquartered in Washington, D.C. with offices in London and Hamburg. Visit https://getfount.com for more information.
Contact:
press@getfount.com

What is a chief customer officer?
FOUNT’s Chief Experience Officer, Anne Eidelman, contributes the following insights to an article on the ChurnZero company blog. Read the full article.
Chief customer officer vs. chief experience officer
Some companies modify the title and responsibilities to better suit their needs. Anne Eidelman sets a good example. She’s the chief experience officer for FOUNT Global, Inc., a SaaS business focused on reducing work friction.
It’s not just the title that’s different, but the report structure. She has customer-facing teams reporting to her and that includes the product team. The company has determined, for their organization, that product experience goes hand-in-hand with the customer experience.
“Our company is helping to improve the experiences of employees because we’re working to reduce friction in their day-to-day work. For us, the word ‘experience’ has a really important meaning.”
Anne Eidelman, Chief Experience Officer at FOUNT Global, Inc.
Even though her role is somewhat different, the motivation behind it is similar. SaaS companies that want to grow “have to really pay attention” to their customer base. That requires having a single executive responsible for pulling together insights from the different teams to get a broad perspective of customers’ needs.
“At that top level, I’m making sure that we are coherent around what we are trying to solve for our customers and what kind of experience we’re trying to provide.”
There’s also an implicit message to customers in her title. What the company’s leadership is trying to do with a chief experience officer is demonstrate “there’s a broader mandate across our customer-facing teams and frankly even more broadly to center on customers and their needs.”
It’s worth noting that Anne comes from a non-traditional background. She’s a trained scientist accustomed to using the scientific method for discovering the root cause of problems. She also served as the CEO of an education non-profit for several years before taking on this role.

The Future of Work is Flow: Interview with Christophe Martel
“Companies that win will be the ones that can provide to their workers—all of them, not just a few—an environment and a job in which people can get into that state of flow.”
Christophe Martel, co-founder and CEO of FOUNT Global, Inc.
FOUNT Cofounder and CEO, Christophe Martel, recently sat down with Adam Mendler, a nationally-recognized authority on leadership, to discuss the future of work. You can read the full interview here. Select excerpts are featured below.
Adam: How did you come up with your business idea and know it was worth pursuing? And then what advice do you have for others on how to come up with and test business ideas?
Christophe: First, I’ve always really liked and needed data to make decisions and to generally think about stuff. In my role as a business leader, I spent a lot of time looking at customer data to figure out what to do better, how to grow the business, how to operate, etc. And there’s a lot of data available to guide that kind of decision-making.
Moving to HR, I found myself pretty much data-less when it came to understanding what in HR was working or not working. It’s very difficult in HR to know if you’re doing a good job because, really, the only way to know is if people stay longer at the company and whether they are more productive. It’s honestly very difficult to attribute these things to any one particular action that HR took to try and make that happen. So, as a business leader, I actually felt this question was a kind of black box of talent and leadership where you have to have good leadership, and – if you do – then people will stay longer or work harder. But it always felt like a very cryptic thing.
And then there was the world of productivity and how much time do people spend on what tasks etc., which really represents the heart of the business in a way, but felt very incomplete. I thought that by moving to HR, I would be able to figure out a way to bring these things together. How is it that people actually decide to stay at a company, work harder, perform better, etc.? I felt like there was no visibility into things I could do to improve any of these outcomes. From a business or an HR perspective, the tools were missing to give visibility into what gets in the way of people trying to be successful at work. That felt like an opportunity.
The idea for FOUNT was very much based on my own lived experience as an executive on both sides of the fence–business and then HR–and also my experience as an employee at different large companies for a fair amount of my career. The impetus was knowing what kind of potential nonsense you may be subjected to as an employee—and usually unbeknownst to the leadership in the company to try and put these things together.
Adam: What are your three best tips applicable to emerging leaders and to senior leaders?
Christophe:
- In general, the famous book from Marshall Goldsmith, “What Got You Here Won’t Get You There,” is very true. In other words, whatever you know, you can lean on, but as an emerging leader (e.g. a frontline manager becoming a leader, an individual contributor becoming a frontline manager), if you’ve never done it before, what you know from your experience being an individual contributor may actually go counter to becoming a good manager or leader. Just being aware of that is a really important step.
- The second one is that teams actually begin with individuals. Within really large teams, it’s easy to lose sight of the fact that everyone is a person who has their way of doing things—their aspirations, their moods, whatever. And even though it can be sometimes daunting because if you have a really large team, it’s hard to keep track. But actually, that’s the job. You have to have at least some understanding of who these people are and how they’re coming together, which is easily lost as you become more senior.
- The third one is that leaders are not made, they’re elected. In general, good leaders are those who are elected by their teams to go and have bigger teams. Therefore, the most powerful person in the room is not your boss. It’s actually the people who work for you.
Adam: What do you believe is the future of work?
Christophe: I don’t know how distant this future is, but the future of work is flow. Companies that win will be the ones that can provide to their workers—all of them, not just a few—an environment and a job in which people can get into that state of flow where their higher self is engaged and where they’re self-realizing through their work. I think that’s what individuals aspire to and eventually, they’ll get their way because companies are competing for people. The more that the system of companies and workers matures, the more workers will dictate the terms of the deal, which is essentially, “I’ll work for you if you can offer me that.” This is something we believe at FOUNT. Individuals aspire to high performance most of the time, and if you can provide a place where they can do that, and feel great about themselves when they come back home, that would be the future of work.

An Ecosystem Approach to Learning and Development
HR may need to adjust its preferred ways of working to get the partners it needs to fertilize the soil for learning and development.
Have you ever trained and trained and trained… and nothing changed? I once spent a year as Head of L&D at a consulting firm, trying to convince the C-suite that our organizational culture and incentive structures were smothering our skill development efforts like seeds in rotten soil. It was a long year.
Now, as Head of Research at FOUNT Global, I work in much more fertile soil. One of our favorite sayings here is, “Change the environment, not the flower.” It comes from a story one of our clients told us years ago, about how she used to use training, motivational workshops, leadership events, and communication campaigns to try to “change the flowers”—until she realized that the flowers weren’t the problem. Their environment was the problem.
What If It’s Not the Flowers?
Train all you want, if your organization is riddled with bureaucracy, burdensome process, broken systems, unhelpful relationships, and all kinds of other friction, your people will still not be able to do the thing you want them to do at the end of the day. HR must get that stuff out of their way.
Because friction fouls up the soil employees grow in, eliminating friction in your organization could dramatically improve your training outcomes. And in many ways, learning and development professionals are ideally positioned to spot friction: Every request for training is an attempt to solve a problem—and an opportunity to root-cause that problem. Why do employees need a training? Why aren’t they behaving as the organization desires? What’s getting in their way? If the answer to these questions isn’t “there’s a knowledge/skill deficit in the flowers,” you’ve probably got some friction to eliminate in the growing environment.
Unfortunately, the State of EX 2022 report suggests most HR teams aren’t currently well equipped to do that.
Nobody Wants to Garden with Us
Learning and development activities are relatively siloed in HR. Sure, we need input and some measure of collaboration from the target training populations and maybe IT to build an appropriate intervention, but for the most part, we build the intervention, because we’re the experts. That makes solving knowledge/skill deficit problems relatively simple. (Emphasis on “relatively”!)
In contrast, 76 percent of respondents to the State of EX survey said the top influencer of employee experience (EX) isn’t HR at all, but business unit leaders and managers. Which means much of the friction that prevents employees from achieving training outcomes isn’t owned by HR. It’s owned by other corporate functions, business units, frontline managers, and other people HR doesn’t control. And 79 percent of survey respondents said they struggle to coordinate EX improvement work across these owners.
Where does this struggle come from? There might be a tendency for business leaders and managers to consider all people work “HR’s job”—i.e., not their job. Indeed, 76 percent of survey participants said their organizations assign primary accountability for EX to HR, not organization-wide, which would seem to encourage non-HR colleagues to shrug off the influence they have on EX and shirk their role in improving it, even if they own the friction.
We see evidence of this attitude in some of the data. For example, of the EX professionals who took the survey:
- 72 percent said their EX/HR team usually owns or leads EX improvement projects, rather than supports or enables them
- 82 percent said the data they use to improve EX is managed by the EX/HR team, rather than the business
- 90 percent said EX improvement projects are most often initiated by the EX/HR team, rather than the business
Similarly, when we asked EX professionals who their most important partners are, they said business leaders, hands-down. But when we asked who their most helpful and frequent partners are, they bumped everyone in HR (including People Analytics, the COEs, and HRBPs) up above business leaders.
Maybe It’s a Little Bit of Us
However, we have reason to believe that the business has very good reasons for not wanting to cooperate with us. When we compare business leaders’ survey responses to those of EX and HR professionals, they look really different on some dimensions. For example, business leaders were much more likely than EX and HR professionals to say that:
- Their organizations’ EX data is inadequate for their needs
- Their most valuable EX data comes from targeted employee listening, rather than enterprise-wide employee listening
- Financial (as opposed to HR or people) outcomes are most important when improving EX
- They communicate specific EX priorities to employees themselves, not just HR and other leaders/managers
These differences seem to paint a picture of business leaders and managers who want more targeted data to solve pressing people-related business problems. They want to be able to tie the impact of solutions to their bottom line. And they want employees to be informed of what’s going on.
In contrast, the responses of EX and HR survey participants suggest they want to solve big, enterprise-wide problems at scale (training, anyone?), and their current listening tools are indeed more appropriate for this than for targeted solutioning. They probably also want to tie the impact of solutions to the business’ bottom line, but they haven’t figured out how to do it. And they’re less concerned about letting employees know what’s going on than they are about keeping senior leaders informed.
There’s a disconnect here. The business needs small, local solutions that show up quickly on the balance sheet. Meanwhile, HR is focused on big, broad solutions, which tend to take a long time to bear fruit. All of this makes perfect sense given each party’s organizational position and sphere of responsibility. But if business leaders and managers are the real EX-influencers in the organization—as survey respondents agreed they are—HR may need to adjust its preferred ways of working to get the partners it needs to eliminate friction and fertilize the soil for learning and development.
Gardening Together, Inside HR and Out
HR’s need to coordinate across friction owners highlights the increasing interconnectedness of all parts of modern organizations. How much more does that interconnectedness apply across HR divisions themselves. It’s faster and easier for L&D professionals to simply fulfill a request for training. That’s their mandate. Someone else does EX. Someone else does friction. But that “it’s someone else’s job” attitude isn’t solving problems, outside or inside of HR. Real solutions begin at your door, when you tell a business leader who asked for a training, “We’ve identified a small environmental change we could quickly make together to fix this problem without training. Would you like HR to help with that?”
This article was authored by Jennifer E. Sigler, Head of Research at FOUNT. It was originally published in Training magazine.
.svg)
Don't miss our latest content
Subscribe to our monthly newsletter


.svg)
.svg)